


Bio-Physical Assessment
Air Quality
Gurugram, a rapidly growing urban hub in the National Capital Region (NCR), continues to face significant air quality challenges. As per the monitoring data (2020-2024), collected from Sector 2 IMT, Manesar, the air quality index (AQI) was calculated from the concentration of various pollutants (PM 2.5, PM 10. SO2) of all the 12-months. The monthly AQI of the area ranges between ‘satisfactory, 51-100)’ (AQI-70) in August 2020 to ‘very poor, 301-400’ (AQI-356) in November 2021.
AQI trend over a five-year period (2020-2024)
The daily AQI data for the past five years (2020-2024) was also collected. The data revealed that the year 2021 is the most polluted because this year is having the maximum number of days of ‘severe (401-500)’ category AQI and the least number of days of ‘good (0-50)’ category AQI. On the other hand, the year 2024 is the least polluted in the last five years. In 2024, number of days of ‘good’ category increased to 18 and the ‘severe’ category days decreased to 0 (zero).
AQI trend over a five-year period (2020-2024)
(Maps sourced from Hydrogeological Report, Atal Bhujal Yojana, 2024-2025)
Water Availability and Quality
The Gurgaon block, due to rapid urbanization, falls in the overexploited category in terms of ground water extraction since 2013 (Master Plan for Artificial Recharge to Ground Water in India, 2013). The pre-monsoon depth to water level in the block ranges from 2.35 mbgl (meter below ground level) to 116.85 mbgl & post monsoon water level ranges from 1.65 mbgl to 115.3 mbgl. The annual extractable ground water of the Gurgaon block is 1654.7 ha.m (hectare meter) whereas, the current annual water extraction is about 1990 ha.m (Hydrogeological Report, Atal Bhujal Yojana (2024-2025).
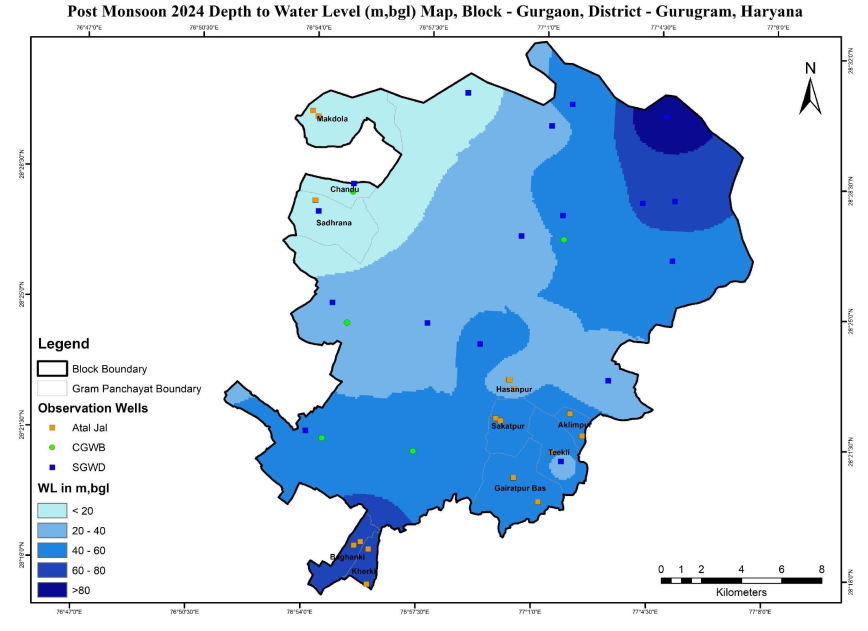
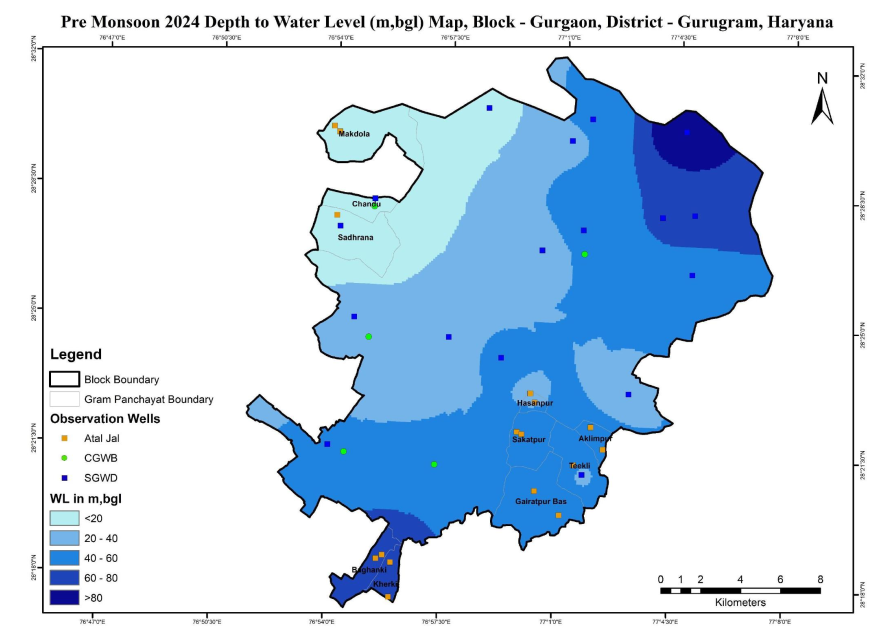
(Maps sourced from Hydrogeological Report, Atal Bhujal Yojana, 2024-2025)
Water Quality
According to the report of the samples analysed from the Krishi Vigyan Kendra, Shikohpur, the ground water of the study area falls under C1S1 (good) in Naurangpur, Gairatpur Bas; C1S2 (good to moderate good) in Shikohpur; and C2S2 (moderate good) in Sakatpur classes of irrigation classification. Similarly, the surface water of the study area falls under C1S1, C1S2, C2S1, and C2S2 classes of irrigation classification.
In ground water, the pH in all the villages ranges from 7.59 to 8.03 whereas, in the surface water it ranges from 7.20 to 7.82, which indicates that ground water is slightly more alkaline as compared to surface water.
The electrical conductivity of all the samples (ground and surface water samples) is well within the desirable limit of less than 750 µs/cm.
In the collected samples, the HCO3 in ground water varies from 4.5 – 8.2 mg/l and in surface water it ranges from 1.8 – 7.8 mg/l.
Sodium (Na, mg/l) in surface water samples is an indication of the soluble sodium content of the groundwater and used to evaluate Na hazard. The concentration of Na is categorised into three categories – Low (<20); Medium (20-60); and high (>60). The Na content in the collected surface water samples varies from 0.42 mg/l to 6.6 mg/l.