


Geo-spatial Analysis
Geospatial analysis forms a cornerstone in understanding the physical and ecological conditions necessary for eco-restoration planning. This includes the detailed interpretation of the terrain, vegetation, land use dynamics, drainage patterns, temperature trends, and soil moisture conditions across the Sakatpur–Gairatpur Bas–Shikohpur–Naurangpur sector of the Aravalli hills near Gurugram. The results discussed herein are based on extensive analysis of remote sensing data, topographical maps, and GIS-based spatial modelling.
These insights provide a critical baseline for evaluating landscape vulnerabilities, ecological restoration potentials, and the identification of strategic intervention points in the study area. Extensive analysis of remote sensing data, topographical maps, and GIS-based spatial modelling was undertaken for the geo-spatial study. Geospatial tools including LANDSAT-8, 9 and IRS LISS IV imagery supported land use and vegetation mapping, slope analysis, and identification of degraded areas for intervention.
The selected project site offers a unique opportunity to pilot a scientifically grounded, community-inclusive model of ecological restoration in an urbanising landscape. The strategic location, ecological relevance, legal status, and community interface make it a high-priority zone for interventions that align with regional and national environmental goals.
Assessment Summary of Geo-spatial Analysis
| S. No. | Assessing Points | Key Findings | Remarks |
|---|---|---|---|
| 1. | Slope Analysis | Ranges between 0° to 36° | About 80-90% of the area has a gentle slope |
| 2. | Digital Elevation Model (DEM) |
Elevation varies from 254 to 364m Two physiographic units were identified:
|
Two physiographic units identified |
| 3. | Normalised Difference Vegetation Index (NDVI) |
|
The NDVI shows that the area is devoid of dense vegetation |
| 4. | Land Use Land Cover (LULC) |
|
LULC indicates rapid urbanisation and significant loss of forest area |
| 5. | Drainage Network and Watershed | Area consists of seasonal water channels, including monsoonal channels, drains, and canals. | It is observed that natural streams are drying up, their path is deviated due to encroachment and urban expansion |
| 6. | Land Surface Temperature (LST) and Urban Heat Island (UHI) |
|
It reflects the expansion of urban built-up areas and limited vegetation and forest cover |
| 7. | Soil Moisture Content (SMC) |
NDMI classifies the area into three categories:
|
|
LiDAR (Light Detection And Ranging)
In the field of ecological restoration, Unmanned Aerial Vehicle (UAV) sensors are especially significant. They offer a detailed view of damaged ecosystems, encompassing key indicators such as vegetation cover, water body conditions, and soil quality. Airborne LiDAR sends laser pulses to the ground and measures the reflected signals to obtain high-precision terrain and surface feature data, which can accurately measure the height, density, and structure of vegetation, providing important data support for ecological restoration.
Advantages of LiDAR
- Quick with very high accuracy and resolution
- Ability to penetrate vegetation (dense canopy)
- Efficient and fast data acquisition and processing
- Feasible and accessible for all areas
Usage of LiDAR
1. Assessing Current Conditions
(a) Terrain Mapping
(b) Vegetation Structure
( c) Ecosystem Mapping
(d) Carbon stock estimation
2. Planning Restoration Strategies
(a) Targeted Restoration
(b) Simulation and Modelling
( c) Monitoring Restoration Progress
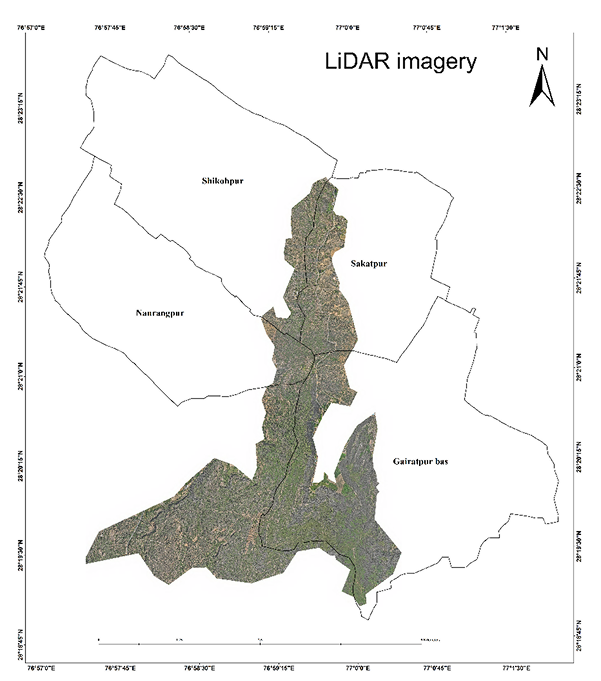
LiDAR imagery of the project area
Slope
Slope maps are crucial for eco-restoration as they help identify areas vulnerable to erosion, and water runoff, allowing for targeted restoration efforts. They also indicate land suitability for different vegetation types and land uses, guiding decisions on where to focus on revegetation, soil stabilization, and other restoration techniques.
Key observations :-
- Slope of the study area ranges from 0o – 36o.
- Spatial slopes variations may be divided into classes i.e., gentle (0o – 3o), moderate (3.1o – 18o) and high (above 18o).
- The maximum of the area is having the gentle slope whereas the minimum area falls under the high slope.
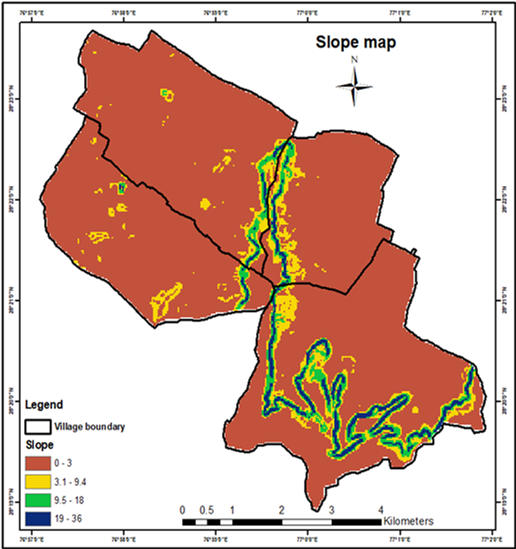
Slope map of the project area
Digital Elevation Model (DEM)
DEMs are crucial for eco-restoration efforts as they provide detailed information about terrain, which is essential for understanding water flow, soil erosion, and habitat suitability.
The elevation of the study area varies from 254 – 364 m above sea level. Physiography of Aravalli Hills in mature topography with plains, low linear ridges and isolated hillocks. In general, Aravalli Hill region of NCR can be divided into two different physiography units as :
- Alluvial flood plain and old flood plain that is 200 m above mean sea level.
- Hilly rocky, Ridges and off shoots of Aravalli that are visible above 200 m above mean sea level.
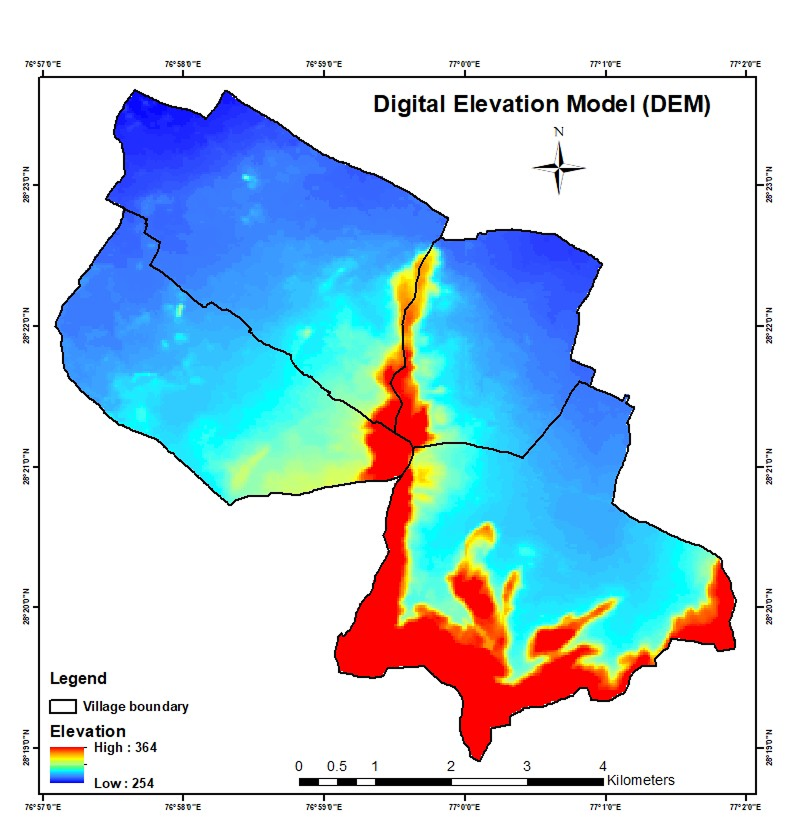
Digital Elevation Model (DEM) map of the project area
Normalised Difference Vegetation Index (NDVI)
The NDVI is a numerical indicator that assesses the amount and health of vegetation using remote sensing data.
High NDVI values (close to +1) indicate healthy, dense green vegetation; while moderate (0.2 to 0.5) suggest sparse, low values indicate little or no vegetation and negative values indicate water bodies or non-vegetated features. The modest improvement indicates some recovery of vegetation cover, possibly from natural regeneration or small-scale interventions. However, the low-to-moderate NDVI values suggest widespread sparse or degraded vegetation, necessitating large-scale native species plantation.
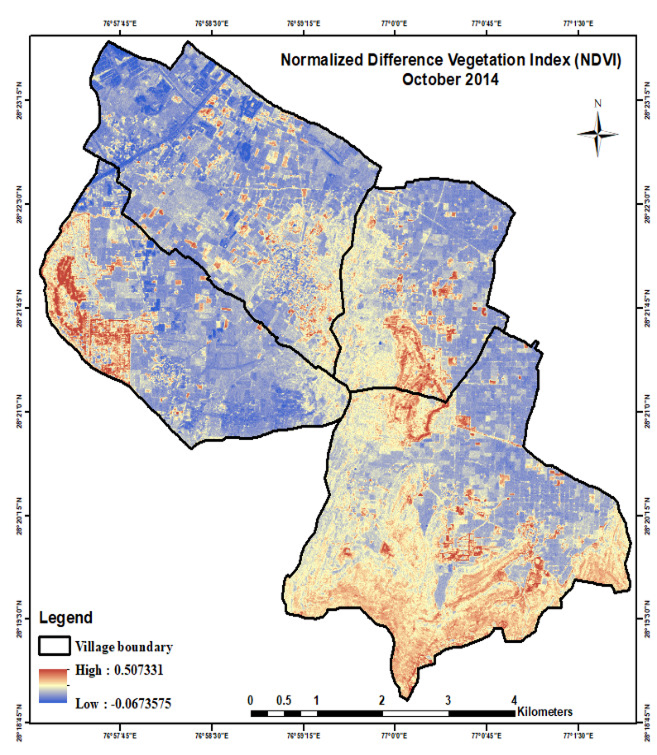
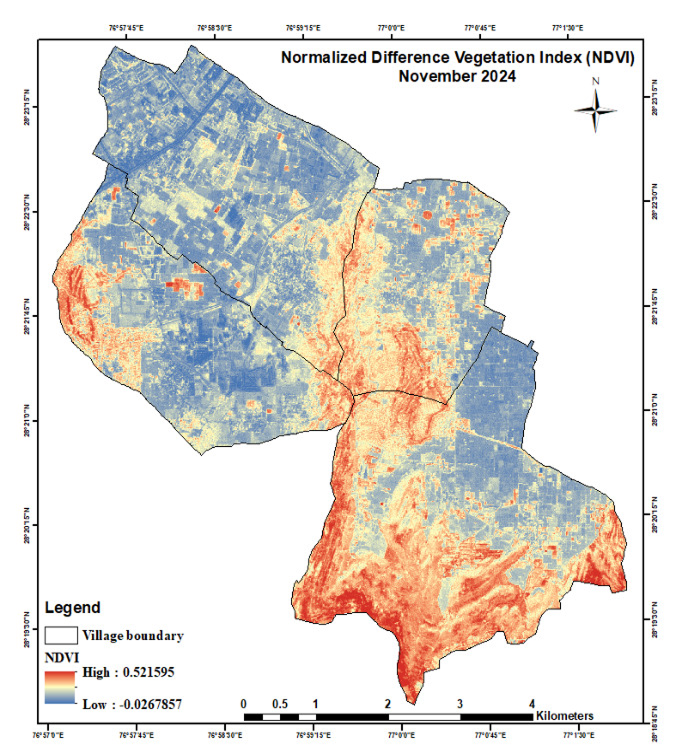
NDVI map of 2014 vs 2024 of the project area
NDVI values of the Villages
NDVI (2014) | NDVI (2024) | |||||
MIN. | MAX. | MEAN | MIN. | MAX. | MEAN | |
Shikohpur | -0.067 | 0.507 | 0.132 | -0.027 | 0.451 | 0.157 |
Sakatpur | -0.057 | 0.469 | 0.164 | 0.042 | 0.455 | 0.221 |
Naurangpur | -0.046 | 0.487 | 0.151 | -0.015 | 0.473 | 0.183 |
Gairatpur bas | 0 | 0.493 | 0.194 | -0.015 | 0.521 | 0.255 |
LAND USE LAND COVER (LULC) map
The Aravalli hills within the National Capital Region face particular environmental pressures from rapid urbanization and population growth. Expanding urban centres must accommodate both residential needs and economic activities, driving land acquisition that dramatically alters the region’s natural landscape and land cover patterns.
Multi-temporal analysis using LISS IV satellite imagery reveals these transformations, distinguishing between natural changes and human-induced impacts. The Aravalli’s location within the NCR makes it especially vulnerable to ecological degradation, emphasizing the importance of remote sensing for monitoring change rates and spatial patterns over time.
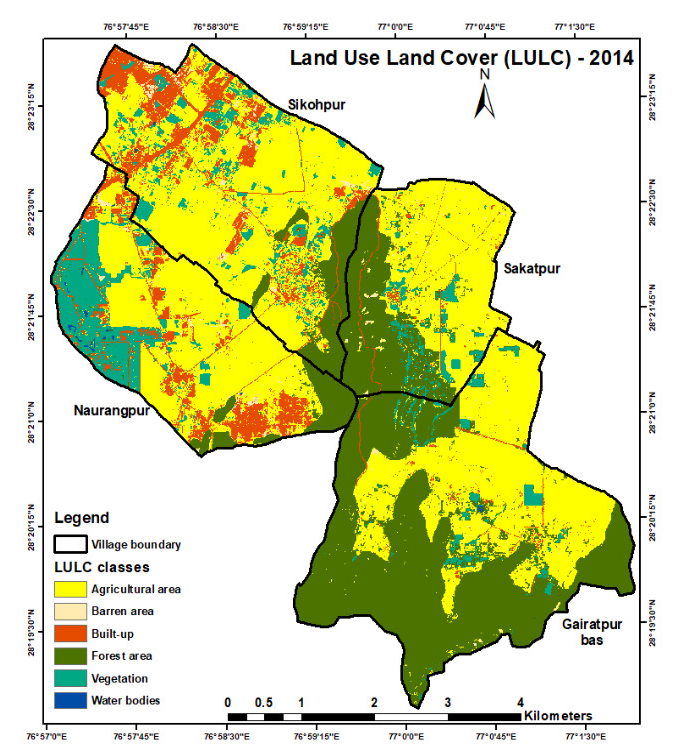
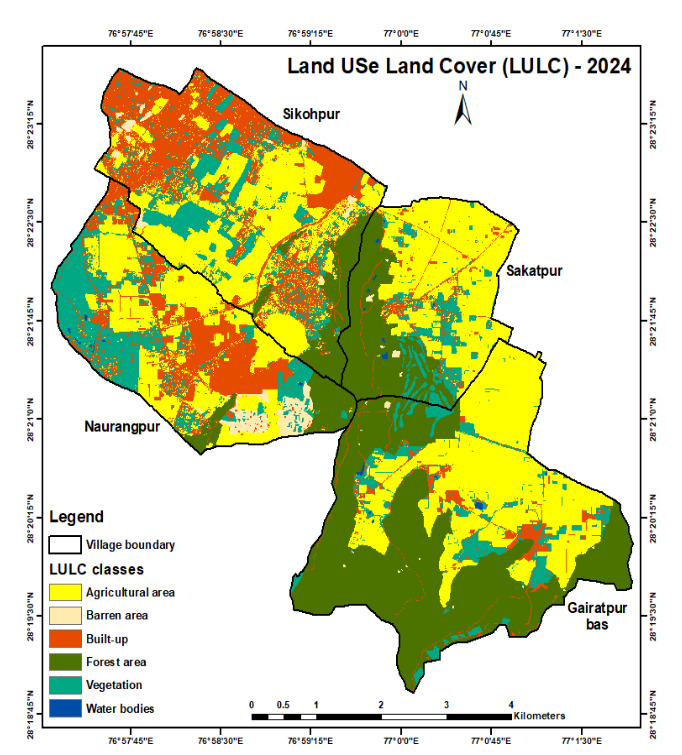
LULC map of 2014 vs 2024 of the project area
Linear Imaging Self Scanner – LISS IV data collected for two time periods of 2014 and 2024 has been used in land use / land cover analysis. Land has been categories into six major land use / land cover classes:
Agricultural area
Barren area
Built-up
Forest area
Vegetation
Water Bodies
Table below shows the changes in LULC over a period of 10 years :-
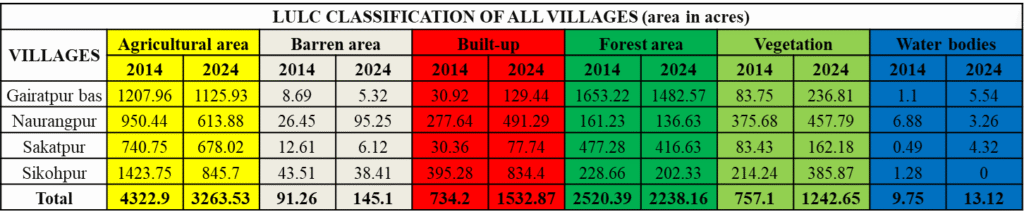
Change matrix of the LULC classification
Villages | Agricultural area | Barren area | Built-up | Forest area | Vegetation (outside forest area) | Water bodies |
Gairatpur Bas | -82.03 | -3.37 | +98.52 | -170.65 | +153.06 | +4.44 |
Naurangpur | -336.56 | +68.80 | +213.65 | -24.60 | +82.11 | -3.62 |
Sakatpur | -62.73 | -6.49 | +47.38 | -60.65 | +78.75 | +3.83 |
Shikohpur | -578.05 | -5.10 | +439.12 | -26.33 | +171.63 | -1.28 |
Total | -1059.37 | +53.84 | +798.67 | -282.23 | +485.55 | +3.37 |
DRAINAGE NETWORK AND WATERSHED MAP
The drainage analysis of the project area reveals a mixed system consisting of seasonal watercourses and small nullahs (natural drainage channels). However, these systems have been significantly altered over time due to expanding urban development and associated land-use changes.
One of the key issues observed is the drying up of many natural streams. This is largely attributed to urban expansion, which has led to the encroachment of natural drainage paths and the depletion of underlying aquifers. As a result, streams that once flowed throughout the year are now reduced to ephemeral channels, active mainly during the monsoon season.
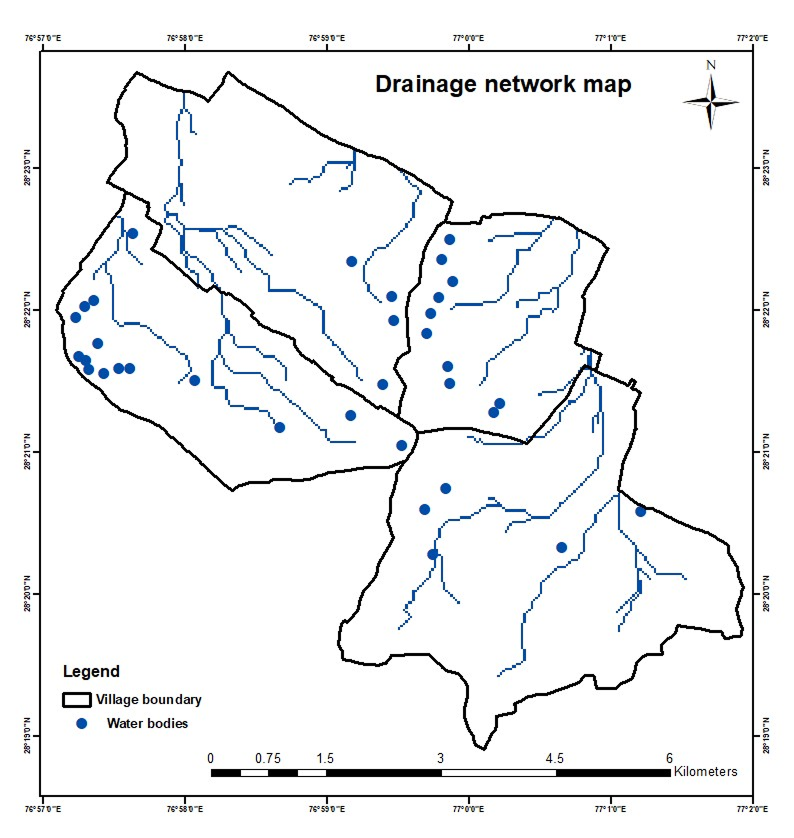
Drainage and watershed map of the project area
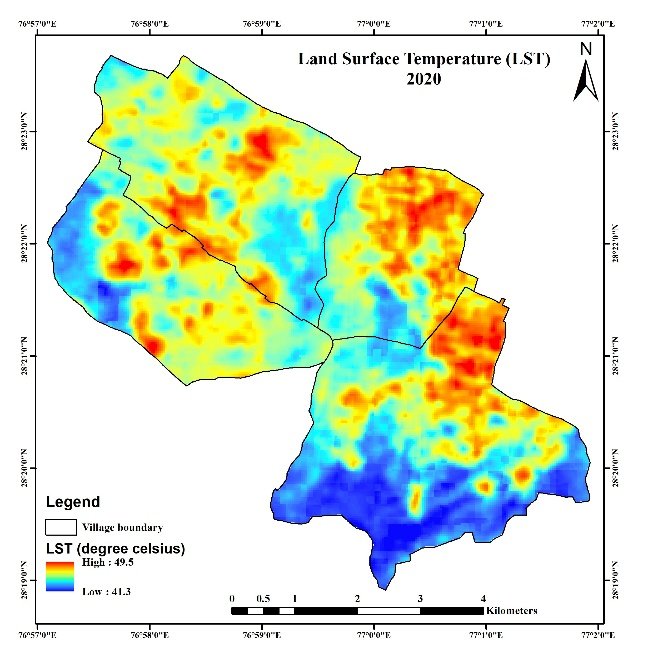
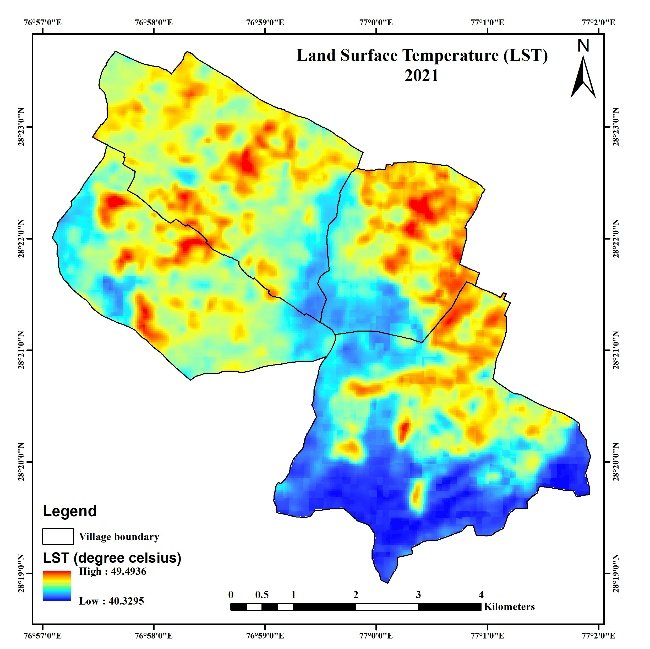
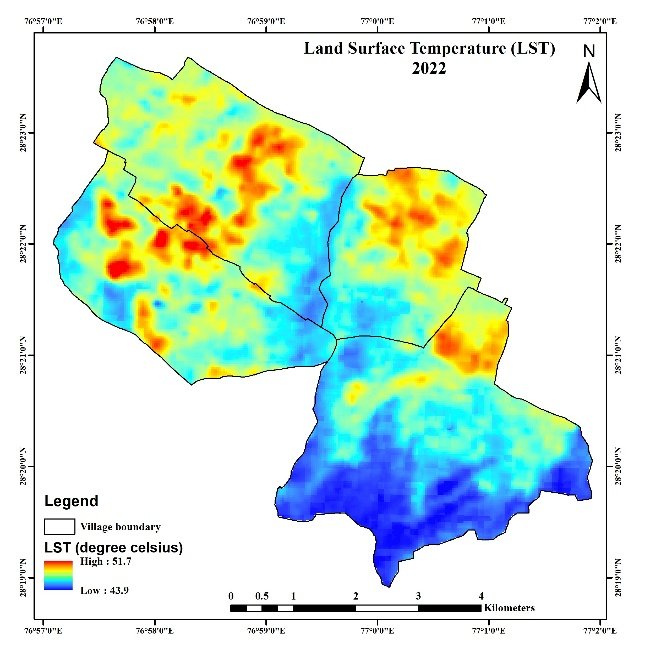
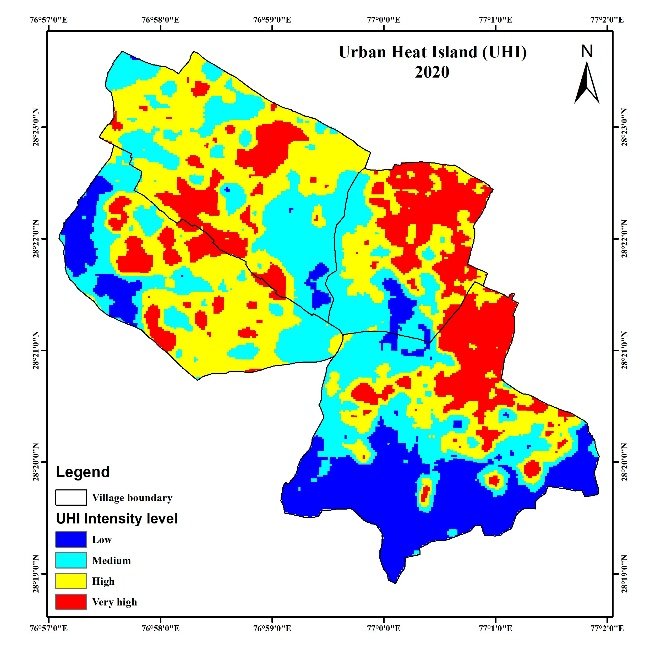
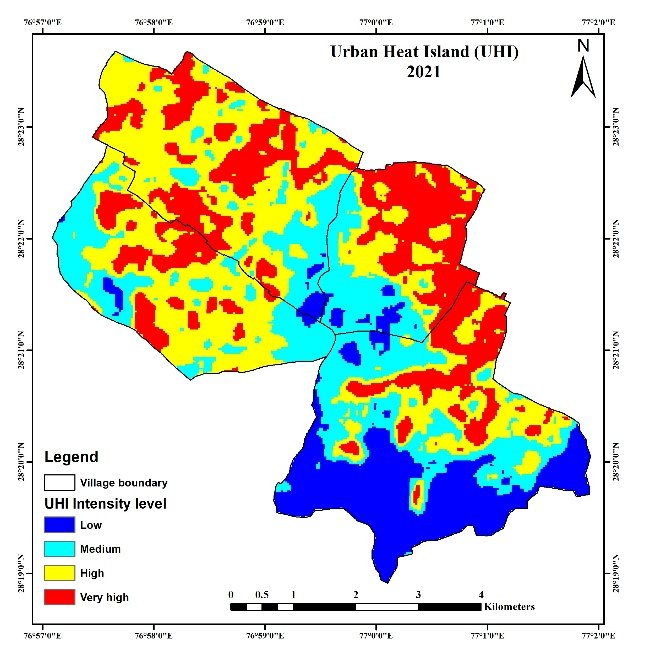
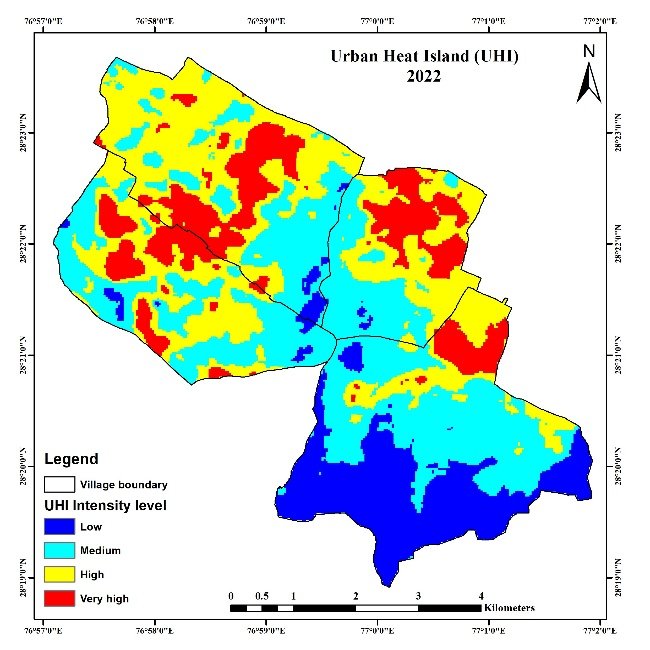
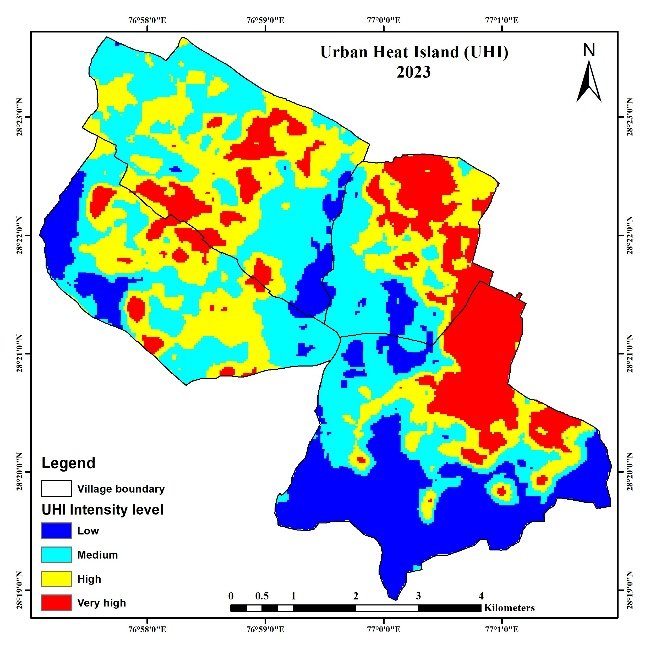
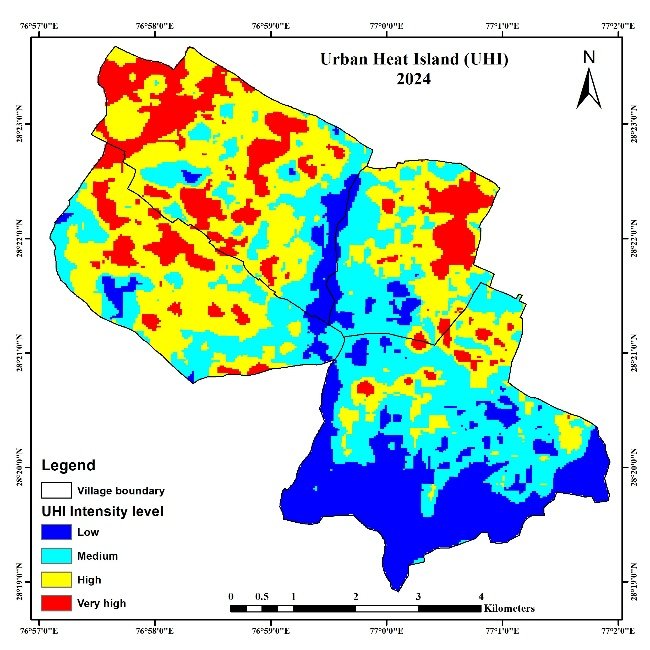
Land Surface Temperature (LST) and Urban Heat Island (UHI)
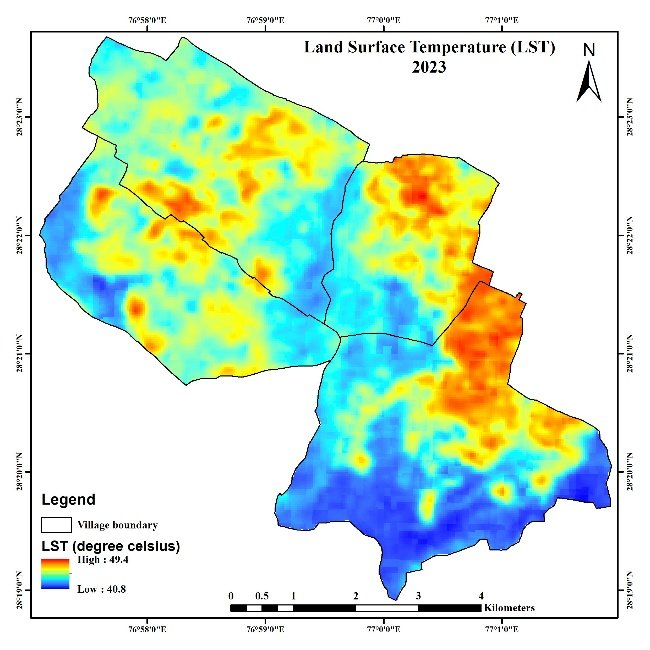
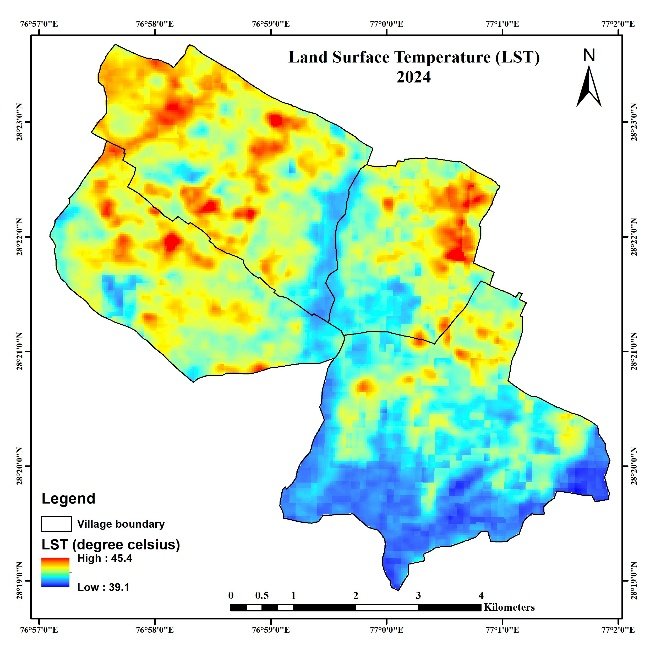
Key observations :-
- The analysis reveals notable variation in surface temperatures, with values ranging from 39.1°C in 2024 to a peak of 51.7°C in 2022. LST maps reflects the significant influence of land use and land cover (LULC) changes, particularly the expansion of urban built-up areas.
- Areas with high built-up density consistently display elevated LST values compared to regions dominated by vegetation, such as forest patches and agricultural fields.
- Spatial pattern highlights the formation of Urban Heat Islands (UHI), where densely developed zones with minimal green cover and high impervious surfaces retain more heat.
- Many locations are identified as high and very high UHI zones, primarily due to their increasing built-up extent and limited vegetation.
SOIL MOISTURE CONTENT (SMC) MAP
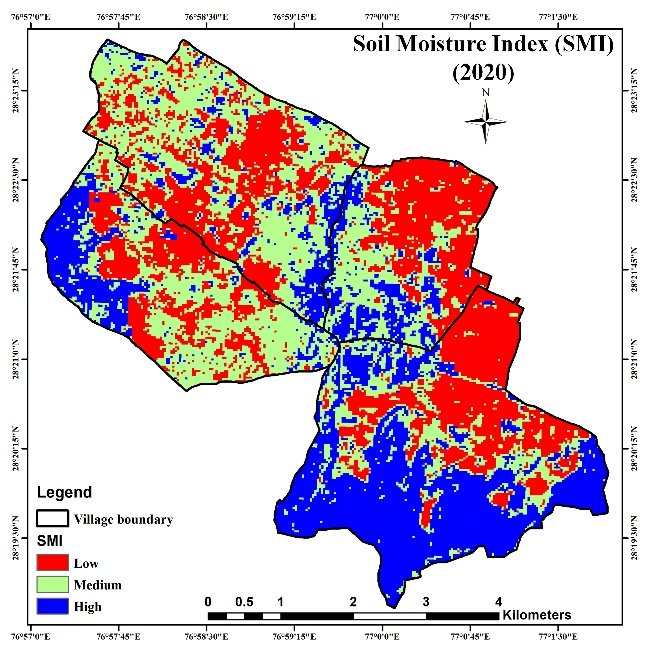
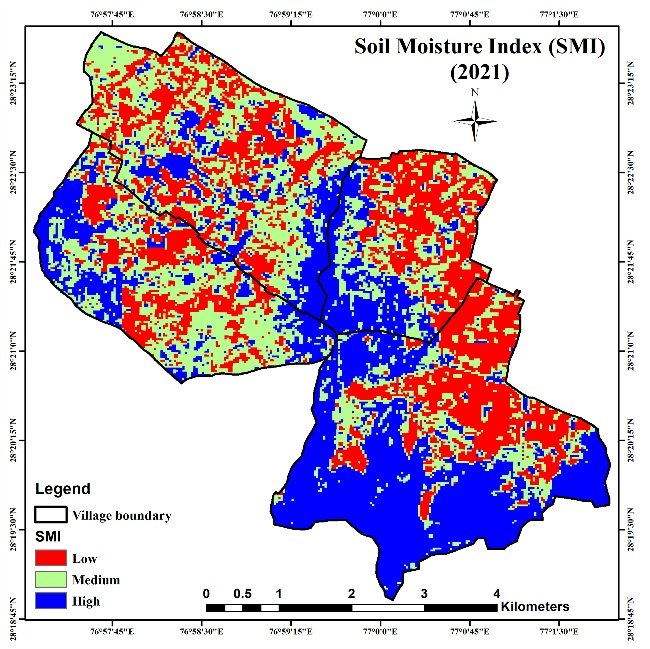
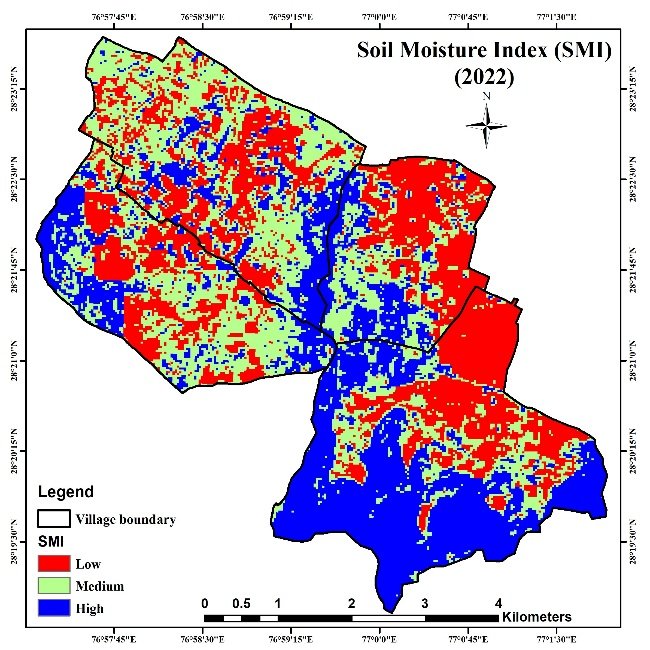
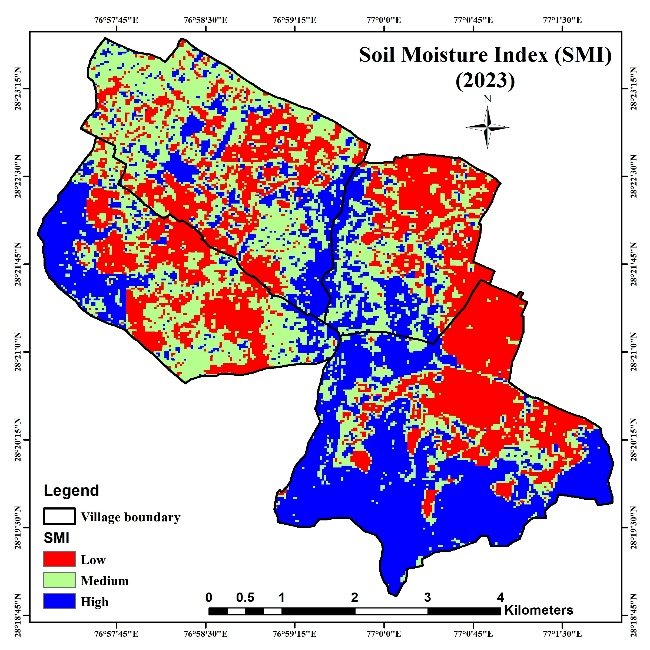
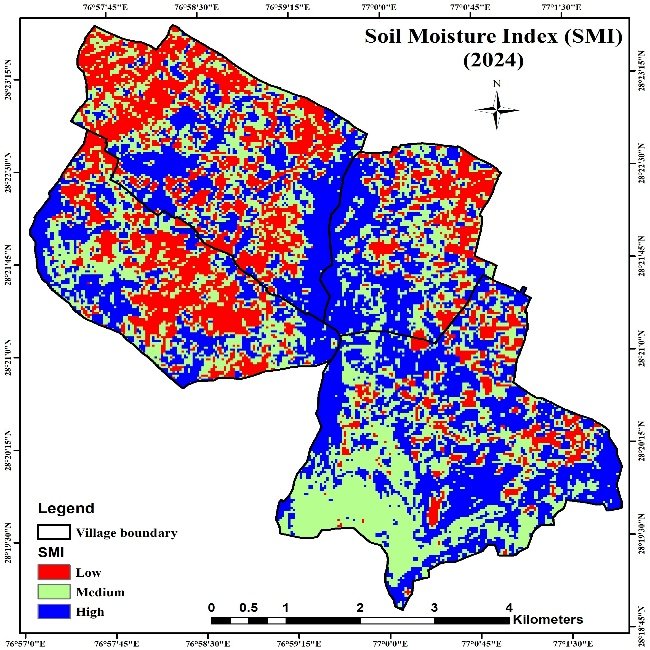
The spatial analysis of NDMI data reveals several key findings:
Dry zones are predominantly located in built-up areas and barren lands, reflecting poor water retention and minimal vegetative cover.
Higher soil moisture levels are consistently observed near forested regions and cultivated agricultural fields, indicating better soil-water interaction and vegetation density.
A declining trend in soil moisture is observed across most village areas over the study period, suggesting a gradual deterioration in soil health likely driven by land degradation, increasing impervious surfaces, and reduced vegetation.