Socio-economic analysis


The Aravallis are home to agrarian and pastoral communities, whose livelihoods are increasingly vulnerable due to ecological degradation. Survey data revealed that over 70% of households rely on agriculture or allied activities. However, crop yields have declined due to poor soil quality, water scarcity, and increased instances of human-wildlife conflict.
Community members, especially women and elders, articulated a strong cultural and spiritual connection to the landscape. Sacred groves and water bodies play a key role in local identity, offering an entry point for nature-based restoration strategies. However, awareness of forest rights and environmental laws remains low.
The gendered dimension of ecosystem uses, and restoration potential was particularly salient. Women engaged in Focus Group Discussions emphasised the need for fuelwood alternatives, water security, and access to healthcare and education, linking ecological health to broader developmental outcomes.

Understanding the socio-economic fabric of the Aravalli region is essential for the preparation and implementation of an inclusive and sustainable eco-restoration plan. The analysis covers demographic trends, livelihood patterns, resource use, and environmental challenges, while also examining the health implications of ecological degradation. The analysis serves as a foundation for understanding the dependency on natural resources and the potential impacts and opportunities of the proposed eco-restoration interventions. The aim is to support data-driven decision-making and ensure that community needs are integrated into the eco-restoration strategy.

Summary of Assessment and Key Findings from the Socio-economic Surveys

S. No. Assessing Points Indicating Parameters Measured Key Findings (Data as per % of responses received)
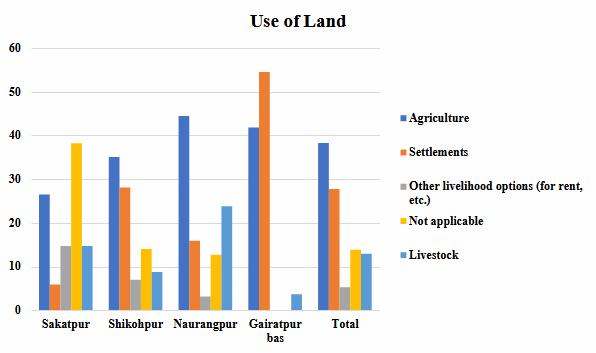
1 Land Ownership and Utilisation
  • Land ownership – agriculture and settlements
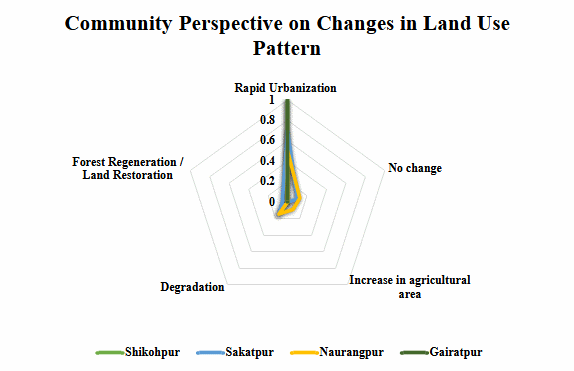
  • Changes in land use patterns
  • Eco-restoration efforts are minimal, with only 5% of respondents reporting forest regeneration in Sakatpur.
  • Degradation is prominent in Sakatpur (15%) and Naurangpur (14.49%).
  • Agricultural expansion is limited, observed only in Naurangpur (9%).
  • Agricultural land is likely to decline gradually.
  • A small portion of land remains unchanged (Sakatpur: 10%, Naurangpur: 12.57%).
2 Water Resource Availability
  • Primary sources of water in the area (domestic use)
  • Sources of water for irrigation
  • Change in water quality over the years
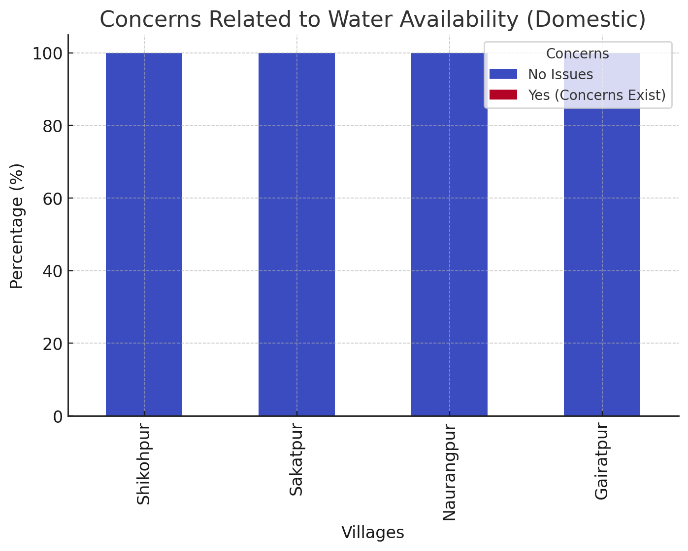
  • Concerns related to water availability
  • Groundwater depletion and declining quality are major concerns (100% in all villages).
  • Irregular rainfall and drought are major issues, especially in Naurangpur (100%).
  • Water pollution is linked to surface water depletion but not directly to rainfall patterns.
  • Water quality concerns are polarised; if respondents believe quality is unchanged, they do not report decline.
3 Livelihood Dependency on Ecosystem
  • Income sources
  • Income diversification scopes
  • Key value chains
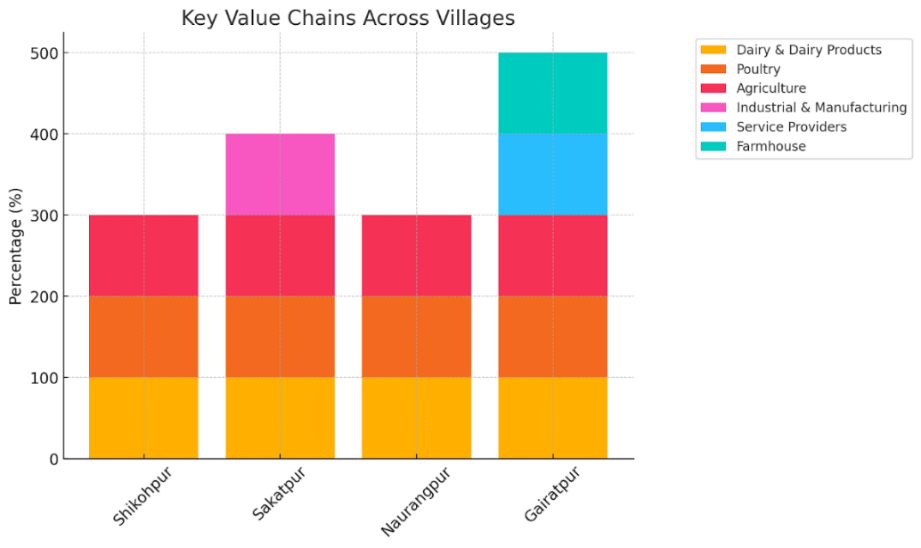
A notable 33.98% of the population falls in the ₹1–₹2 LPA income range. Dairy, poultry, and agriculture are primary economic drivers across all villages.
4 Community Willingness for Restoration
  • Environmental awareness
  • Scope of alternative livelihoods
  • Willingness to participate in green jobs
  • Communities prioritise afforestation, water resource rejuvenation, and soil conservation.
  • Gaps remain in biodiversity conservation, sustainable livelihood development, and climate adaptation.
  • Human–wildlife conflict and invasive species spread are key challenges.
5 Traditional Knowledge and Practices
  • Existing cultural and spiritual heritage
  • Knowledge of medicinal plants
  • NTFP collection and forest-based dependencies
  • Presence of a sacred grove site in the study area.
  • High dependence on firewood, medicinal plants, and NTFPs: Sakatpur (58.83%), Gairatpur Bas (49.1%), Shikohpur (40.36%).
  • Forests used for NTFPs and grazing: Shikohpur (22.81%), Naurangpur (14.29%).
  • Mixed use less common in Sakatpur (5.89%) and Gairatpur Bas (1.82%).
6 Socio-economic Constraints
  • NTFP collection contrast
  • Economic constraints
  • Life and livelihood constraints
  • Health and environment linkages
  • Lack of institutional support (e.g., JFMCs, Van Panchayats) limits forest resource management.
  • Women have limited access to formal credit, restricting eco-enterprises.
  • Reliance on groundwater with no recharge systems; low-return agriculture.
  • Poor waste/water infrastructure and women’s exclusion hinder sustainability.
7 Gender Roles in Ecological Stewardship
  • Gender-based constraints
  • Life and livelihood constraints
  • Access to financial institutions
  • Presence of SHGs & leadership
  • Women actively involved in agriculture, NTFP, dairy, and poultry but face barriers.
  • Limited access to finance restricts eco-enterprise investment.
  • SHGs exist but vary in effectiveness; minimal women’s leadership.
  • Livelihoods remain low-income and labour-intensive with few upskilling opportunities.
8 Educational Awareness on Ecosystem
  • Knowledge base of ecological services
  • Forest dependence
  • Sustainability practices
  • Limited awareness of ecological services despite dependence on resources.
  • Inadequate understanding of impacts of land use change.
  • Low exposure to sustainable harvesting and conservation.
  • Cultural resources present but underutilised.
  • Eco-restoration efforts sporadic and lack structured knowledge.
9 Institutional Gaps
  • Knowledge gaps
  • Absence/weakness of institutions
  • Lack of coordination
  • Weak institutions (JFMCs, Van Panchayats) hinder eco-restoration.
  • Limited capacity/knowledge among officials and leaders.
  • Poor coordination between government, NGOs, and communities.
  • Traditional ecological knowledge under-documented.
  • Women/marginalised groups underrepresented.
  • Unclear roles cause overlaps or gaps in restoration efforts.

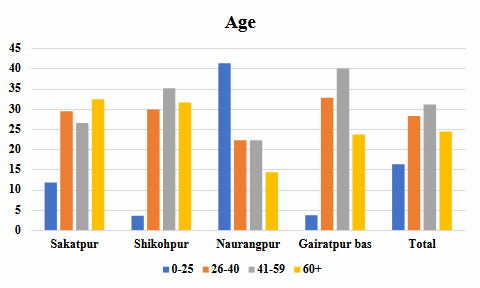
Demographic Profile (Source : Census data, 2011)

Metric Sakatpur Shikohpur Naurangpur Gairatpur Bas
Number of Households 295 520 271 226
Total Population 1657 2900 1440 1228
Male Population 880 (53.1%) 1543 (53.2%) 762 (52.9%) 652 (53.1%)
Female Population 777 (46.9%) 1357 (46.8%) 678 (47.1%) 576 (46.9%)
Literacy Rate 949 (57.3%) 2045 (70.5%) 1049 (72.8%) 797 (64.9%)
Male Literacy 603 (36.4%) 1180 (40.7%) 591 (41%) 501 (40.8%)
Female Literacy 346 (20.9%) 865 (29.8%) 458 (31.8%) 296 (24.1%)
Scheduled Caste Population 392 (23.7%) 357 (12.3%) 266 (18.5%) 191 (15.6%)
Scheduled Tribe Population 0 0 0 0
Working Population 366 (22.1%) 815 (28.1%) 392 (27.2%) 301 (24.5%)
Primary Livelihoods Agriculture, Private Jobs, Labour Agriculture, Private Jobs, Labour Agriculture, Private Jobs, Labour Agriculture, Private Jobs, Labour, MNREGA, Farm Owners

Data Procured in Socio-economic surveys

Assessing Points for the socio-economic surveys

  • Land Ownership and Utilisation
    Indicating Parameters Measured:
    • Land ownership - agriculture and settlements
    • Changes in land use patterns
    Key Findings:
    • Eco-restoration efforts are minimal, with only 5% of respondents reporting forest regeneration in Sakatpur.
    • Degradation is prominent in Sakatpur (15%) and Naurangpur (14.49%).
    • Agricultural expansion is limited, observed only in Naurangpur (9%).
    • Agricultural land is likely to decline gradually.
    • A small portion of land remains unchanged (Sakatpur: 10%, Naurangpur: 12.57%).
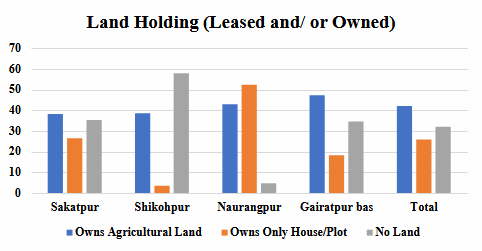
    Chart showing land use patterns Map of agricultural land changes
  • Water Resource Availability
    Indicating Parameters Measured:
    • Primary sources of water for domestic use
    • Sources of water for irrigation purposes
    • Change in water quality over the years
    • Concerns related to water availability for domestic and agricultural use
    Key Findings:
    • Groundwater depletion and declining water quality are major concerns for irrigation (100% in all villages).
    • Irregular rainfall and drought were major issues, especially in Naurangpur (100%).
    • Water pollution is linked to surface water depletion but not directly to rainfall patterns.
    • Water quality concerns are polarized; respondents who believe quality remains the same do not report any decline.
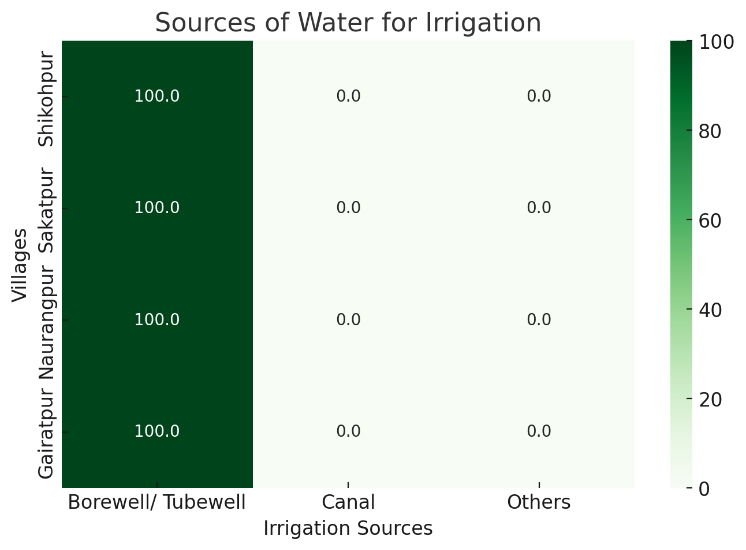
    Chart of water quality trends Graph of groundwater depletion
  • Livelihood Dependency on Ecosystem
    Indicating Parameters Measured:
    • Income sources
    • Income diversification scopes
    • Key value chains
    Key Findings:
    • A notable 33.98% of the population falls within the ₹1-₹2 LPA (lakhs per annum) category, making it the most common income range. Dairy, poultry, and agriculture are the primary economic drivers across all villages.
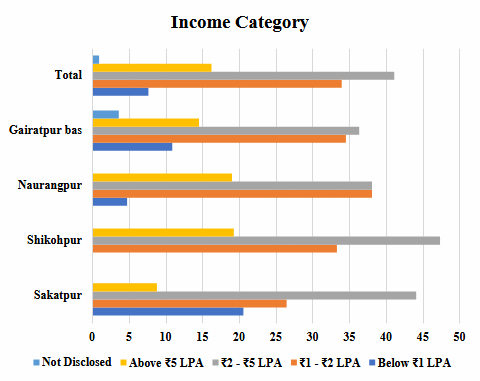
    Chart of income distribution Graph of economic activities
  • Community Willingness for Restoration
    Indicating Parameters Measured:
    • Environmental awareness
    • Scope of alternative livelihoods
    • Willingness to participate in green jobs
    Key Findings:
    • Communities prioritize afforestation, water resource rejuvenation, and soil conservation.
    • Gaps remain in biodiversity conservation, sustainable livelihood development, and climate adaptation measures.
    • Human-wildlife conflict and the spread of invasive species are identified as key ecological challenges.
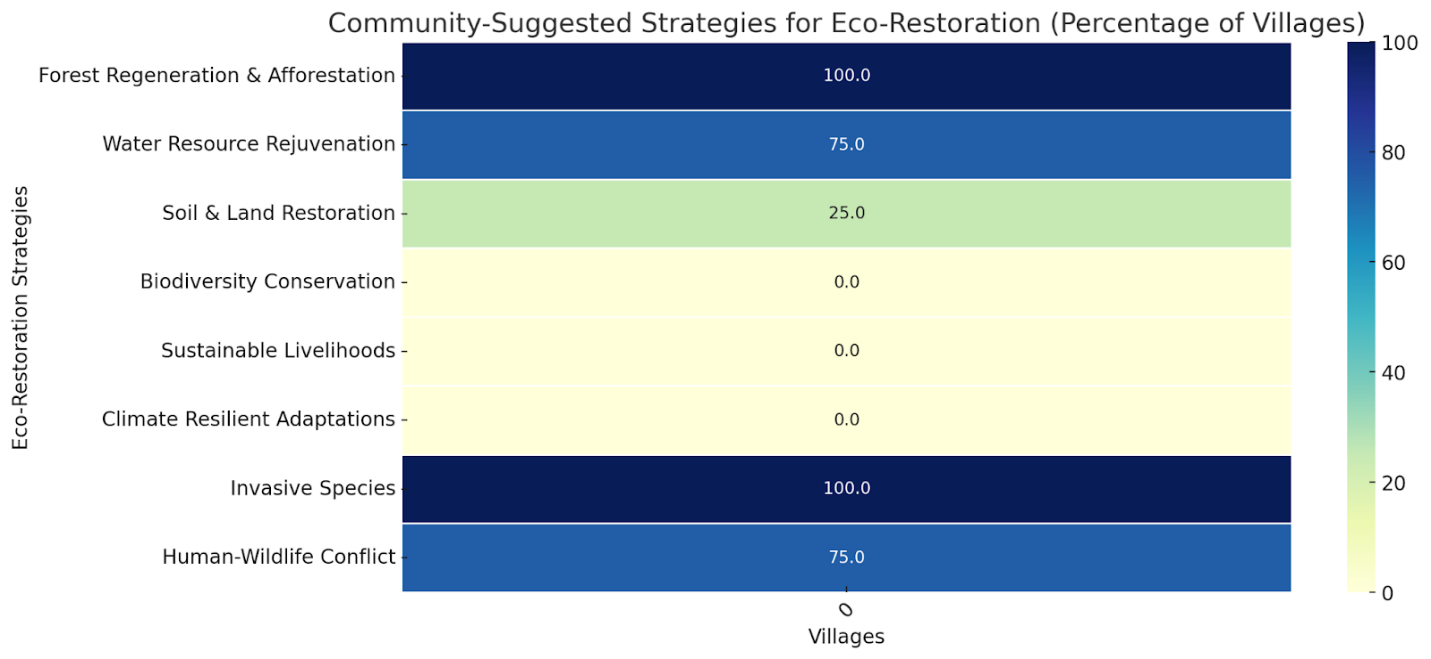
    Chart of community restoration priorities
  • Traditional Knowledge and Practices
    Indicating Parameters Measured:
    • Existing cultural and spiritual heritage
    • Use and knowledge of medicinal plants
    • Traditional practices in NTFP collection and other forest-based dependencies
    Key Findings:
    • Presence of a sacred grove site in the study area.
    • A significant proportion of households rely on firewood, medicinal plants, and other NTFPs: Sakatpur (58.83%), Gairatpur Bas (49.1%), and Shikohpur (40.36%).
    • These NTFPs are essential for cooking, traditional medicine, and small-scale economic activities.
    • Forests are used for both NTFP collection and grazing by 22.81% in Shikohpur and 14.29% in Naurangpur.
    • This mixed-use is less common in Sakatpur (5.89%) and Gairatpur Bas (1.82%), suggesting differences in livestock reliance and forest usage patterns.
  • Socio-economic Constraints
    Indicating Parameters Measured:
    • Contrast with regard to NTFP collection
    • Economic constraints
    • Life and livelihood constraints
    • Health and environment linkages
    Key Findings:
    • NTFP Collection: Lack of institutional support (e.g., JFMCs, Van Panchayats) limits coordinated and equitable forest resource management.
    • Economic Constraints: Women have limited access to formal credit and banking, restricting investment in eco-enterprises.
    • Life and Livelihood Constraints: Complete reliance on groundwater for irrigation with no recharge systems; dependence on low-return traditional agriculture.
    • Health and Environment Linkages: Poor waste and water infrastructure and women’s exclusion from decision-making hinder sustainable management.
  • Gender Roles in Ecological Stewardship
    Indicating Parameters Measured:
    • Gender-based socio-economic constraints
    • Life and livelihood constraints
    • Access to financial institutions
    • Presence of SHGs
    • Presence of women leadership
    Key Findings:
    • Women are actively involved in agriculture, forest resource collection (firewood, NTFPs), and allied sectors (dairy, poultry), but face social, time, and awareness barriers.
    • Limited access to financial institutions restricts investment in eco-enterprises.
    • SHGs are present but vary in effectiveness; women’s leadership in natural resource committees is minimal.
    • Livelihoods remain concentrated in low-income, labor-intensive sectors with few opportunities for upskilling.
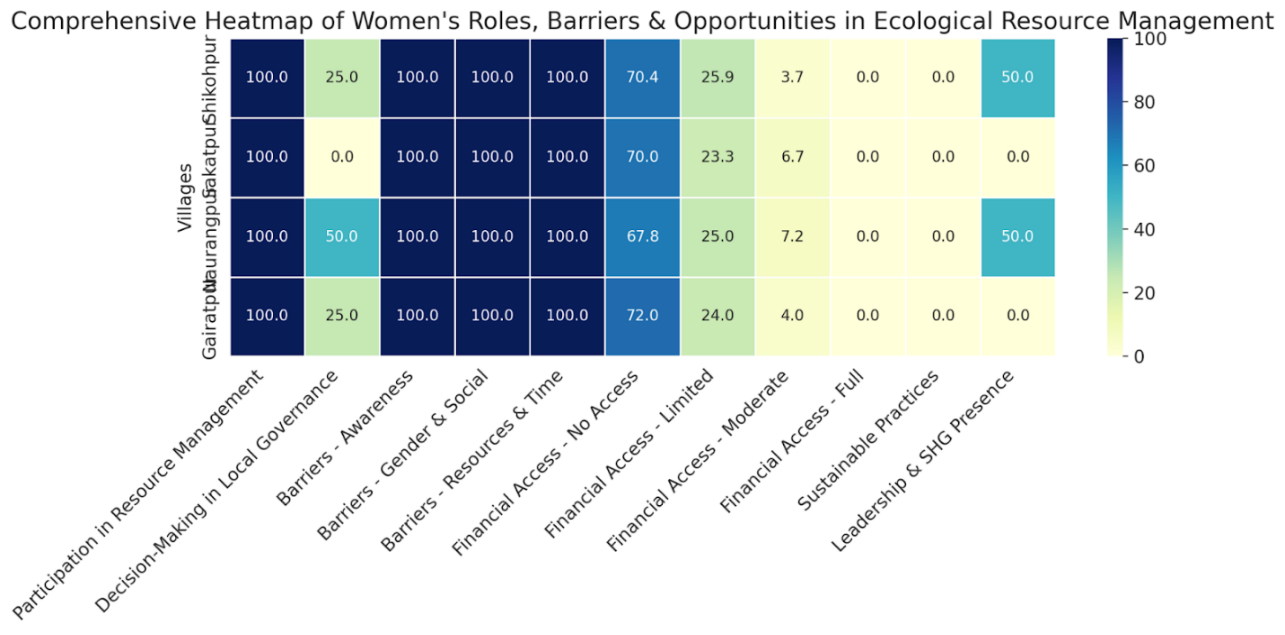
    Chart of gender roles in ecological activities
  • Educational Awareness on Ecosystem
    Indicating Parameters Measured:
    • Existing knowledge base of ecological services
    • Forest dependence
    • Knowledge on sustainability and sustainable harvesting practices
    Key Findings:
    • Limited awareness of ecological services and sustainability practices despite high dependence on natural resources (NTFPs, grazing, water).
    • Inadequate understanding of long-term impacts of land use change (urbanization, degradation, forest loss).
    • Low exposure to sustainable harvesting, forest conservation, and climate resilience strategies.
    • Cultural resources (e.g., sacred groves, trees) are present but underutilized for education or community mobilization.
    • Community-led eco-restoration efforts are sporadic and lack structured knowledge backing.
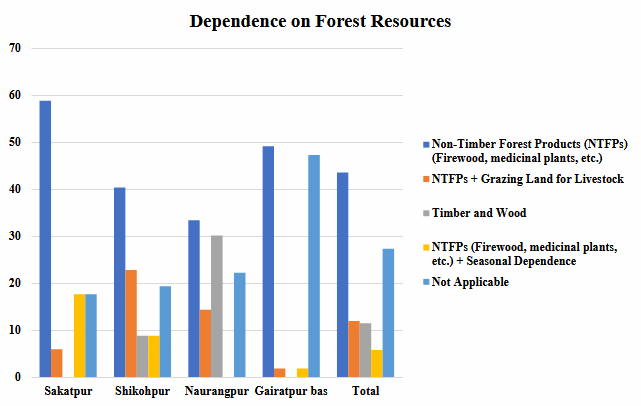
    Chart of ecological awareness levels
  • Institutional Gaps
    Indicating Parameters Measured:
    • Existing knowledge gaps
    • Absence of institutions, or inadequately capacitated
    • Lack of synergy and coordination amongst institutions
    Key Findings:
    • Absence or weakness of formal community institutions (JFMCs, Van Panchayats) limits coordinated eco-restoration and resource management.
    • Limited capacity and environmental knowledge among local institutions, officials, and community leaders.
    • Poor coordination and communication between government agencies, NGOs, local bodies, and community groups.
    • Traditional ecological knowledge is under-documented and not integrated into institutional frameworks.
    • Women and marginalized groups have limited representation and voice within institutions.
    • Stakeholder roles and responsibilities are unclear, causing overlaps or gaps in restoration efforts.
Cart (0 items)